

Yap - Finance API Demo
 This free desktop software application helps traders to analyze and compare stock details effectively. With a Finance API, the app queries various API versions to fetch real-time, historical and analyst stock data. Its cross-platform development ensures seamless performance on Windows, macOS and Linux, leveraging the speed of C++ and the versatility of the Qt Toolkit.
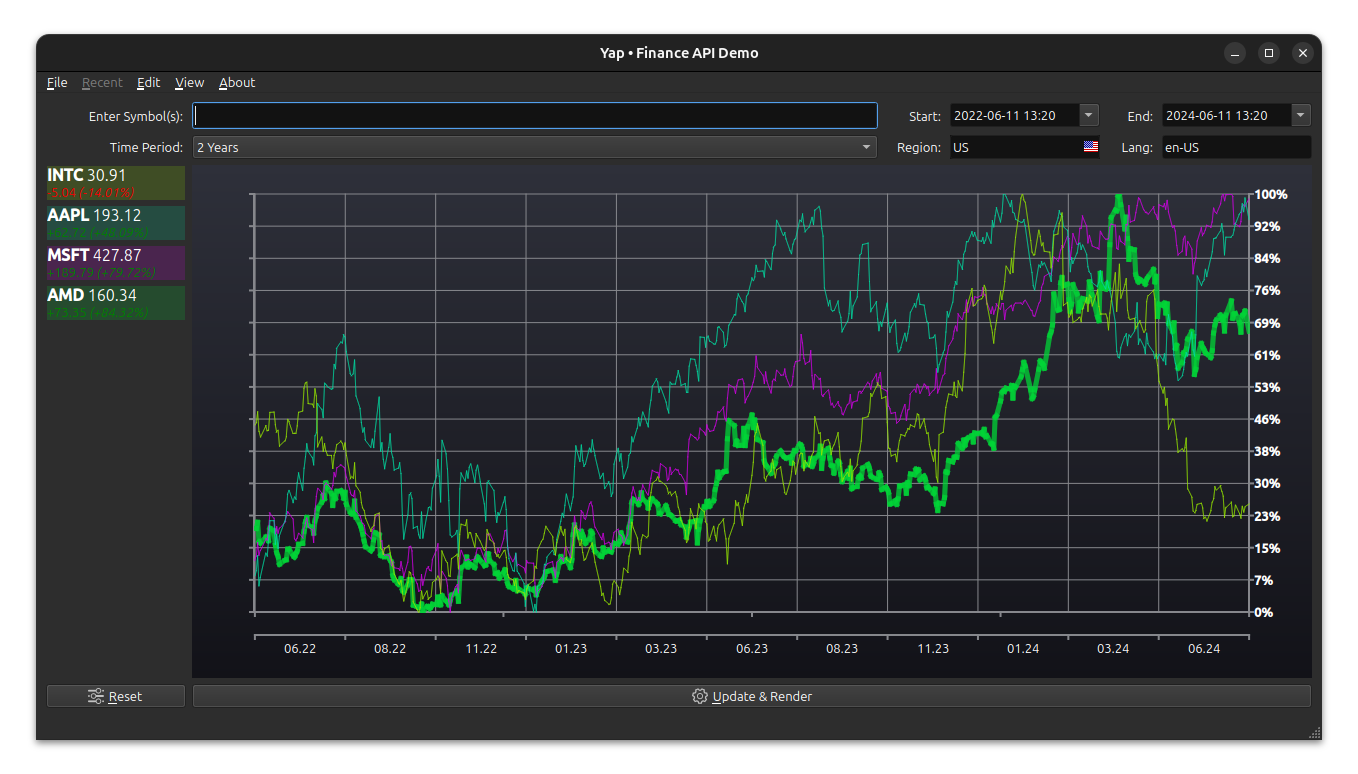
With Yap users can draw a variety of chart types, including CandleStick Charts, Spider Charts, and Histogram Charts for specific timeframes.
Creating charts is as simple as right-clicking on a symbol and selecting the desired chart type, allowing for easy comparison of multiple symbols.
Advanced zoom and pan features enhance interactivity, with basic zoom functions supported by click, drag, and mouse-wheel controls, and the escape key quickly resetting the zoom level. Customizable line charts enable users to change line colors at any time and highlight lines by clicking on the symbol. Different chart background grid types can be selected from the menu.
Advanced features cater to more experienced users, who can add multiple symbols quickly by submitting titles separated by a space character. The application allows for direct comparison of different timeframes to analyze stock performance.
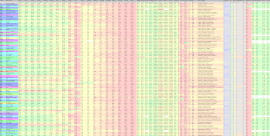
Users can save advanced analysis details to an Excel xlsx file, facilitating the comparison of various details of all entered symbols in beautifully colored, large Excel sheets. Its important to ensure that Microsoft Excel is closed before writing to the same filename; check out LibreOffice Calc. An example exported stock sheet set is available for all major indexes.
For example the application calculates volatility and win probability for each title and time period, making it perfect for comparing the performance of many symbols at once.
The executables are compiled statically for Windows, macOS and Linux, ensuring robust performance across all platforms. Yap supports very big high-resolution fullscreen charts, providing a clear and detailed view of stock data. Some operating systems even benefit from hardware-acceleration. Released under the GNU/GPL License, this app is 100% free and it comes without a warranty!
With its powerful features and user-friendly interface, this desktop software application is an essential tool for traders looking to analyze and compare stock details efficiently.
Downloads
 Yap - Finance API Demo - Windows x86 MinGW
13,3 MB (13.345.282 bytes) md5 f146c127b466a88a08ed1d5cfc64346e
Yap - Finance API Demo - Windows x64 MinGW15,0 MB (14.968.237 bytes) md5 fff7a9fc44df1a60be4309bdd9efe1bc
 Yap - Finance API Demo - macOS x86_64 Static
7,5 MB (7.506.864 bytes) md5 5455f2e812378e4b4fee882e839b887b
 Yap - Finance API Demo - Linux noble & plucky
16,9 MB (16.854.472 bytes) md5 6ee23cc042a19a26caeb7bedfa4387f5
The latest version was built on November 18 2025 15:18:30
Features: Relative Strength Index, Cross-Sectional Momentum, Time-Series Momentum
 Yap - Stock Sheet - Dow Jones 30 Industrial Excel xlsx
4,4 MB (4.447.559 bytes) md5 6c6d1c81b8079f50aded0112e8824a44
Yap - Stock Sheet - S&P 100 Excel xlsx13,6 MB (13.587.389 bytes) md5 abbbfb9bfa94beb0eaeca45290f625ef
Yap - Stock Sheet - S&P 500 Excel xlsx61,3 MB (61.314.286 bytes) md5 64a7ce6effcfbc98a95fc009799cdbbf
Yap - Stock Sheet - NASDAQ 100 Excel xlsx12,7 MB (12.734.374 bytes) md5 9c8122af7472c3eba6e315c9adf0dc41
Yap - Stock Sheet - EURO STOXX 50 Excel xlsx6,6 MB (6.643.685 bytes) md5 def9d4c285b2d5fbac20446f3761dd97
Yap - Stock Sheet - Nikkei 225 Excel xlsx26,0 MB (25.964.861 bytes) md5 315facde72cdd76f9e78c46abc0f711c
Yap - Stock Sheet - DAX Excel xlsx4,9 MB (4.931.508 bytes) md5 f2fa6d538d08a052a4bb58dc51d6ddb3
Yap - Stock Sheet - TecDAX Excel xlsx3,5 MB (3.469.728 bytes) md5 a4760275b03fc4a06c28990a7f46b40c
Yap - Stock Sheet - CAC 40 Excel xlsx5,2 MB (5.229.543 bytes) md5 76583fca49f8ab32dc51d607c7e78056
Updated June 2026
Screenshot
So long, and thanks for all the fish.


